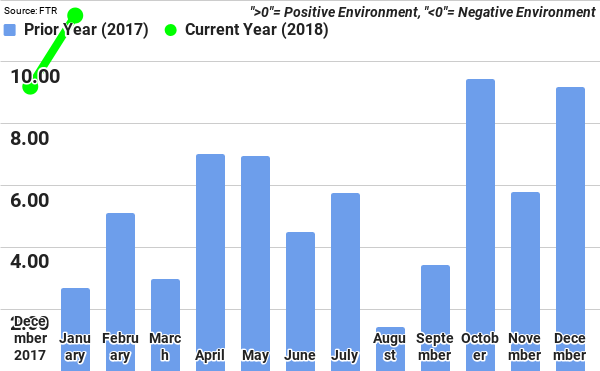
FTR’s Trucking Conditions Index for January, at a reading of 11.5, continued on an upward trajectory reflecting maxed out capacity and the accompanying rate increases being realized by carriers. Trucking conditions have been unusually strong in Q1 with carriers approaching the most favourable environment they have experienced in 14 years. ELD full implementation and strong freight demand will keep the TCI reading in positive double-digits with the peak likely being reached during the second quarter. FTR currently forecasts a softening in the index later in 2018, as increased labor and equipment costs along with slowing rate growth are likely to lead to modest softening of trucking conditions.
Jonathan Starks, Chief Operating Officer at FTR, commented, “Historically, January and February have proven to be lighter months in terms of the shipping environment, resulting in less truckload demand. That is not the case this year.
Truckstop.com’s Market Demand Index is twice the level of January and February 2014, the last time capacity pressures were building up in the system. Carriers continue to hold a dominant position in the market.
“We continue to see a combination of factors that are keeping the market tight, including the full ELD implementation coming on April 1, as well as a strong run in the economic data month after month relating to Industrial Production, GDP, home building, and sales. One possible effect of the increased freight demand and accelerating rates is that less drivers seem to be leaving trucking due to ELDs than many anticipated. However, we need to wait for enforcement data in May to see if drivers are adopting ELDs, or just running loads without them.“
The Trucking Conditions Index tracks the changes representing five major conditions in the U.S. truck market. These conditions are: freight volumes, freight rates, fleet capacity, fuel price, and financing. The individual metrics are combined into a single index that tracks the market conditions that influence fleet behaviour.
A positive score represents good, optimistic conditions. Conversely, a negative score represents bad, pessimistic conditions. The index tells you the industry’s health at a glance. In life, running a fever is an indication of a health problem. It may not tell you exactly what’s wrong, but it alerts you to look deeper. Similarly, a reading well below zero on the FTR Trucking Conditions Index warns you of a problem, while readings high above zero spell opportunity. Readings near zero are consistent with a neutral operating environment, and double-digit readings (both up or down) are warning signs for significant operating changes.


